With the latest update, we have added the ability to drill down on a month in the trading journal. The journal now has access to numerous detailed trading metrics with break-down on wins and losses.
Why You Should have a Trading Journal
It has been said over and over again by top traders that keeping a trading journal is one of the key ingredients to become a consistently profitable trader.
Yet, most beginner traders refuse to do it and rely on hope of future success to become profitable, a mindset that won´t make a difference and will drain your account with losses exceeding profits.
Keeping a journal and analyzing success and mistakes requires some work and it can be also hard for beginner traders to understand the outcome and results until you have done it.
Almost all beginner traders fall into something called the “Shiny objects syndrome”. They are always looking for something new instead of sticking to a strategy and analyze the result.
This is perfectly natural behaviour and something even the sharpest traders battle with.
Keeping a trading journal works against this bad behaviour and in your favour instead.
The journal is your best companion which will tell you what you should continue to focus on to make profits and what you should stop doing, all without emotions or being affected by the “Shiny objects syndrome”.
Using the journal correctly you will improve by identifying what makes up your losses and move those types of trades out of your strategy.
You will also be able to identify what type of trades you make profit on and continue to improve and focus in that area.
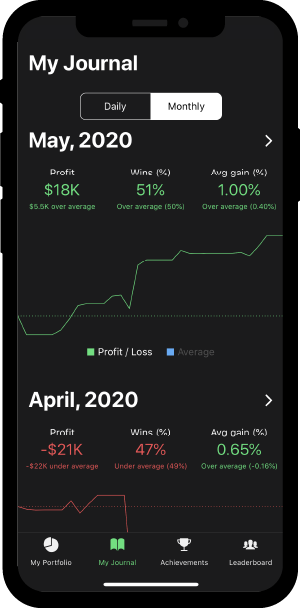
The monthly trading journal gives you a breakdown of the most important trading performance metrics for each month.
New to this screen is the ability to drill down to each month and view detailed trading statistics.
Detailed monthly trading statistics
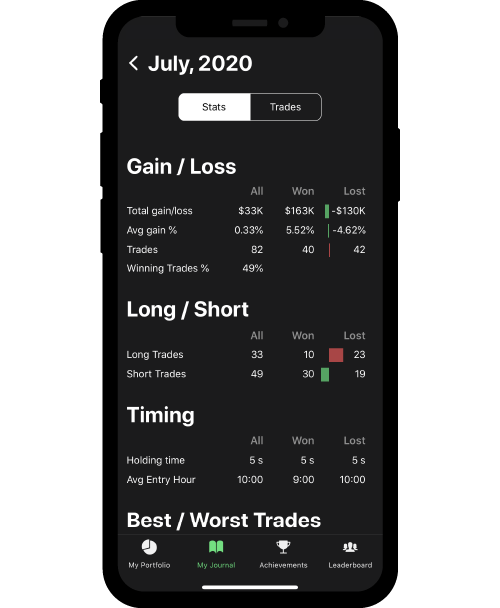
The new improved monthly trading journal lets you drill down on each month to see full detailed trading statistics for that month.
The statistics view has a row for each item and colums for how that item contributed to either your wins or your losses.
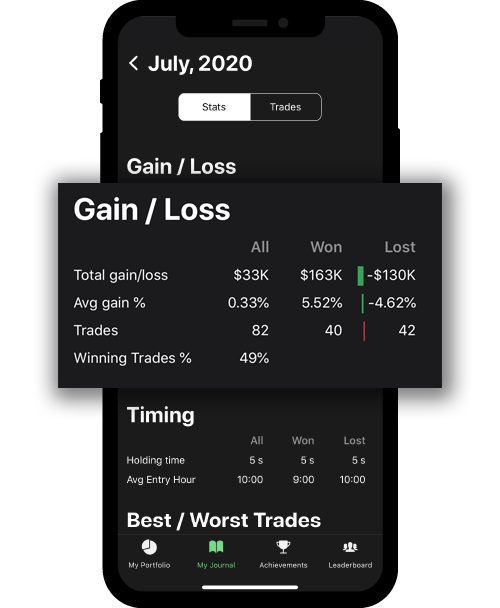
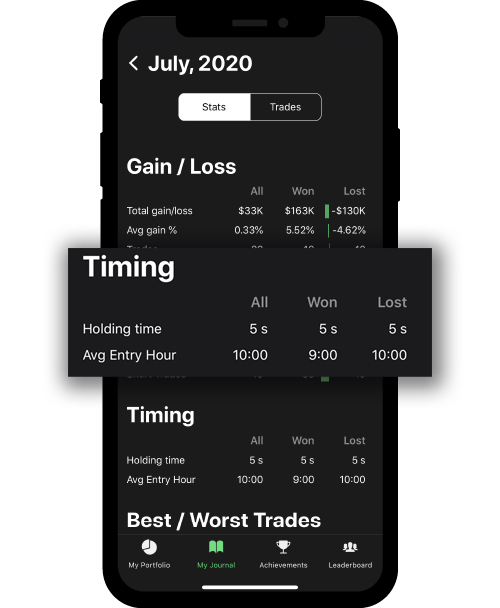
Gain / Loss
This section holds the most basic trading metrics. Your total gain loss with a beak down on wins and losses. Your average gain and your trades which makes up your inning trades in percent.
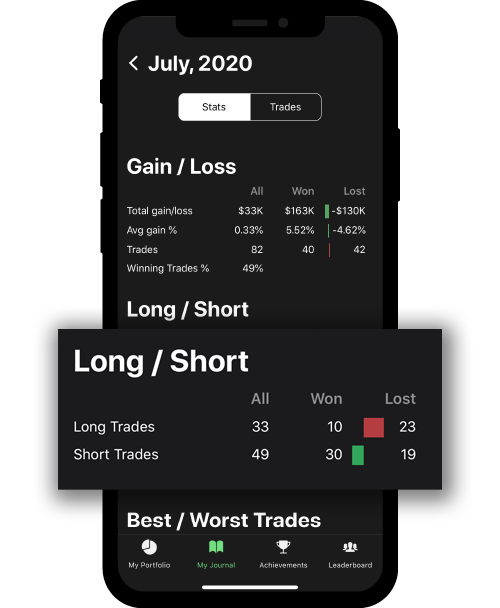
Long / Short
This section provides you with a breakdown on long/short trades. In this example most long trades were wins and most short trades were losses. Still positive that most trades overall were short trades which seems like a winning strategy for this user.
Timing
Timing is an interesting metrics to analyze. As a day-trader you may hold a stock for a few seconds to a few hours or overnight. Is there a pattern to your holding times? Did you hold your winning trades longer or shorter time than your loosing trades?
And at what time of day do you enter your winning and loosing trades?
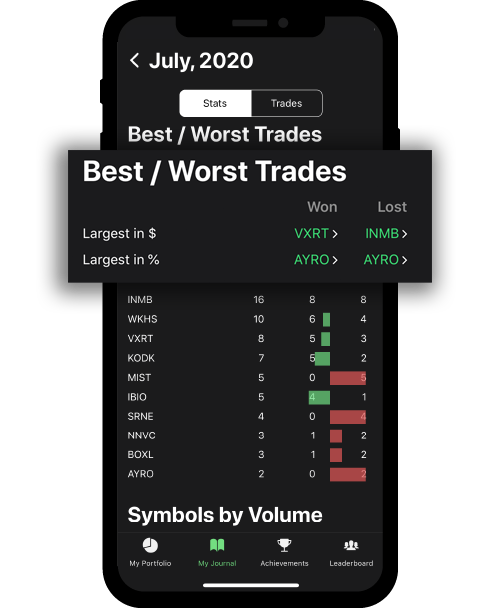
Best / Worst Trades
Did you take a heave loss on an individual trade? Don´t worry, most traders do, though it´s important to be able to go back and identify those trades and review what went wrong. With the Best/Worst trades view you can navigate to those trades and view the details.
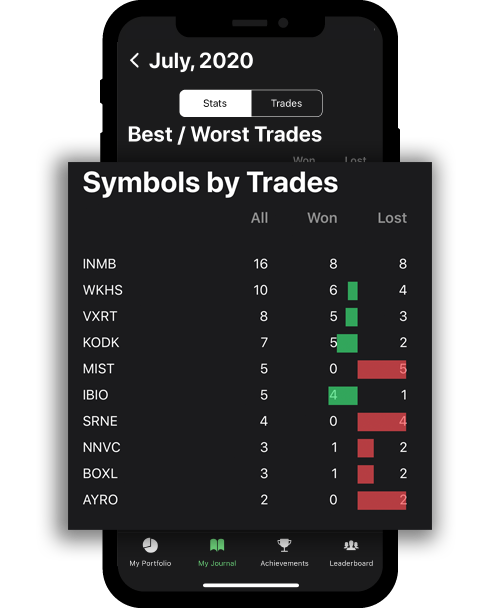
Symbols by Trades
This view shows your top 10 most traded symbols with a break-down whether they were winning or loosing trades.
It´s best used to look for improvement areas. In this case MIST and SRNE, one the top 10 list but all loosing trades, what happened there?
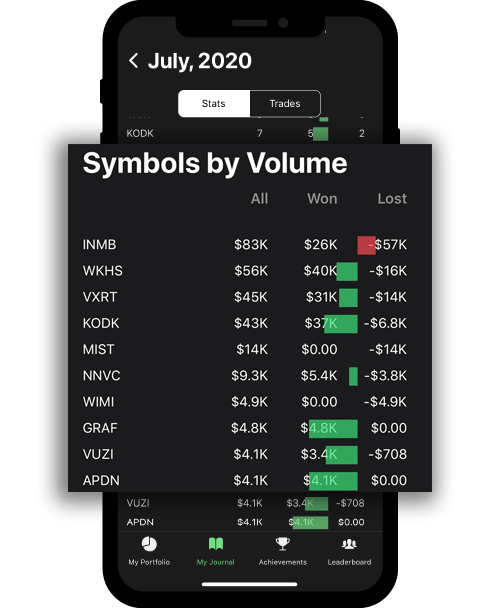
Symbols by Volume
Number of trades gives a good first glance but not necessarily the whole picture, since volume can differ between trades. The symbols by volume view gives you instead the top 10 most trades symbols by volume.
The total volume is made up of both wins and losses.
What´s next
A lot of users have been asking for this type of more detailed trading statistics and the ability to analyze and improve your trading strategy.
The data has always been there and the challenge is often to implement new features in a ways that navigation becomes intuitive and the interface is kept minimal, user friendly and not becomes overwhelming which can easily happen when you add a lot of data.
There will probably be some additional stats and fine-tuning of the interface based on feedback from users. Possibly charting holding time and entry time to get an even better overview of these metrics.
I love getting feedback from users so if you have anything to say, positive, negative or ideas around how I can make kinfo better, please reach out to me.
The best place to reach me is the kinfo discord channel.
I love your idea, but you have to improve the way you calculate the statistics
An example: If last month i just bougth a Call option for 100 usd and it expire worthless, so i los 100 usd, in your my portfolio mail, you are showing i lost 100% in last 1month……. but if may trading account is 40k, it is less than a 1%.
More: you need to implement the profit Cumulative PnL to show the TWR (time weigted returns) as the profit itself, can change if i double the deposit or get money outside the broker.
Make sense?, i will pay a monthly fee, if you improve those things.
Thanls
Kinfo shows performance as profit from realized trades. Not all brokers report account size and the quality and consistency of balance transactions makes it extremely hard to show an accurate TWRR.
Profit from realized trades has proven to be most liked by day/swing traders and also most accurate.
2 Responses
I love your idea, but you have to improve the way you calculate the statistics
An example: If last month i just bougth a Call option for 100 usd and it expire worthless, so i los 100 usd, in your my portfolio mail, you are showing i lost 100% in last 1month……. but if may trading account is 40k, it is less than a 1%.
More: you need to implement the profit Cumulative PnL to show the TWR (time weigted returns) as the profit itself, can change if i double the deposit or get money outside the broker.
Make sense?, i will pay a monthly fee, if you improve those things.
Thanls
Kinfo shows performance as profit from realized trades. Not all brokers report account size and the quality and consistency of balance transactions makes it extremely hard to show an accurate TWRR.
Profit from realized trades has proven to be most liked by day/swing traders and also most accurate.