Learn the basics about how the kinfo platform works
Whether you are beginner or a professional, successful or struggling to make profit, there are certain metrics which are relevant for measuring how well you perform as a trader. In My Portfolio view, you will immediately see metrics such as your overall profit, average gain in both dollar and percentage and your winning trades in percent.
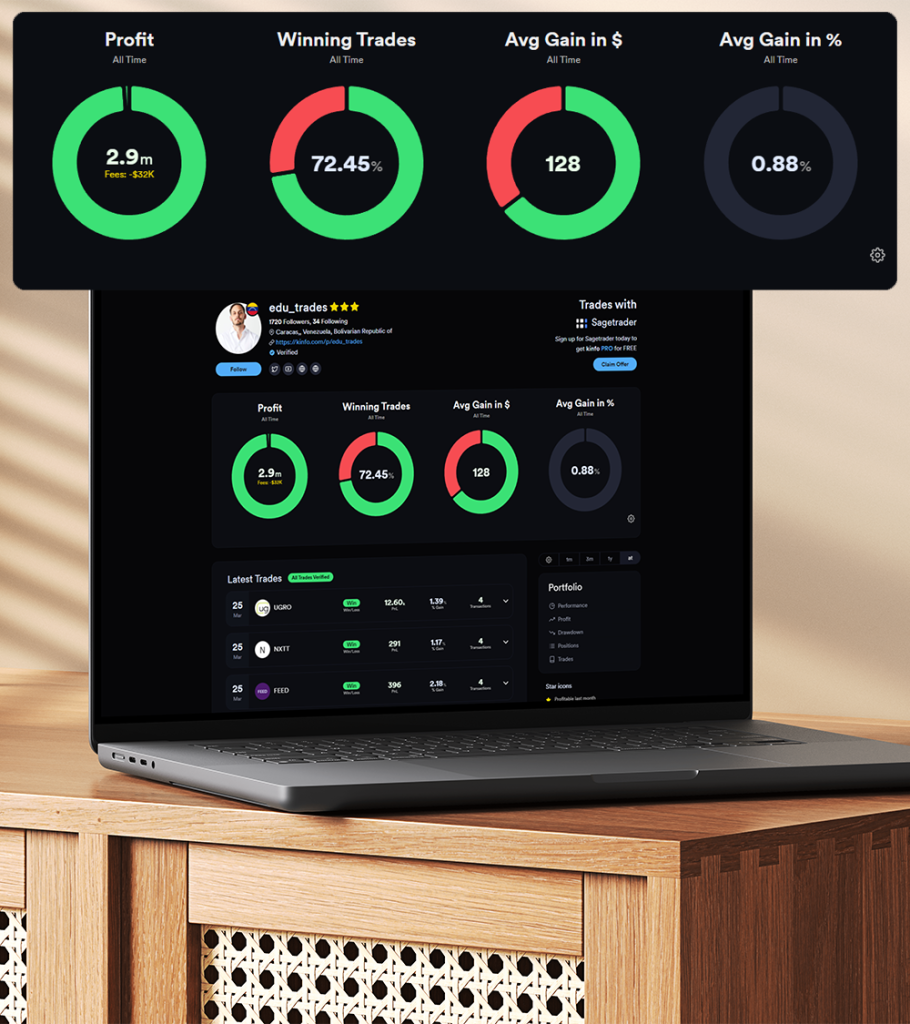
These are the most basic metrics but at the same time the most useful to look at.
There is no “right numbers” since different strategies tend to show different result depending on the person on trading style.
For someone just getting started it´s good to know that a combination of an average gain over 0 and over 50% winning trades is profitable.
While these trading metrics are good to look at to measure your performance, it´s really profit over which counts. Kinfo tracks profit based on closed out trades, if you buy 1 share of AAPL and sell it 2 days later, the trade will close out and the trade is calculated as the difference between the buy and the sell price.
If you buy into a position multiple times, the trade will close out when the last share is sold.
Every time you close a trade, the result — profit or loss — is automatically added to your running track record. Nothing is logged manually, and nothing can be cherry-picked. Over time, these closed trades build into a performance chart that shows the real shape of your trading: the climbs, the drawdowns, and the recoveries.
What matters isn’t any single trade, but the pattern that emerges over weeks and months. A longer time horizon reveals whether you’re genuinely a consistently profitable trader, or whether a few lucky wins are masking less steady results underneath. It’s this honest, long-run view that makes a kinfo track record worth trusting.

The best traders don´t spend all time analyzing the market, they put as much energy into analyzing themselves, learning what they are good at, what contributes to their losses and why. In this exercise two things are important, you need to have the right mindset and self esteem, but you also need access to tools to easy overlook and analyze individual trades.

Your performance chart shows how you’re trading — but to understand why, you need to look at your trades one at a time. On kinfo, every closed trade is stored with full detail: instrument, entry and exit, size, direction, duration, and the profit or loss it contributed.
Reviewing trades individually is where the real learning happens. You can see which setups consistently pay off and which keep costing you. Are your winners running long enough? Are your losses staying small? Is there a particular instrument or market condition where your edge disappears?
Patterns that are invisible in an equity curve often become obvious trade by trade — and that’s what turns kinfo from a simple track record into a tool for improving how you trade.
Kinfo only works with direct broker integrations and will import data as recorded by your broker. It´s not possible to add/update or delete trades or manipulate the data in any way.
Furthermore, this means that the track record shown in kinfo is 100% verified.
We dumped a lot of the noise surrounding investment and focused on what traders really want to know- WHAT ARE BETTER TRADERS DOING?
By simplifying, we focused on what is missing in typical trading apps- collective wisdom. We also avoided adding news-feeds, technical indicators, etc. that you likely already have access to with other tools.