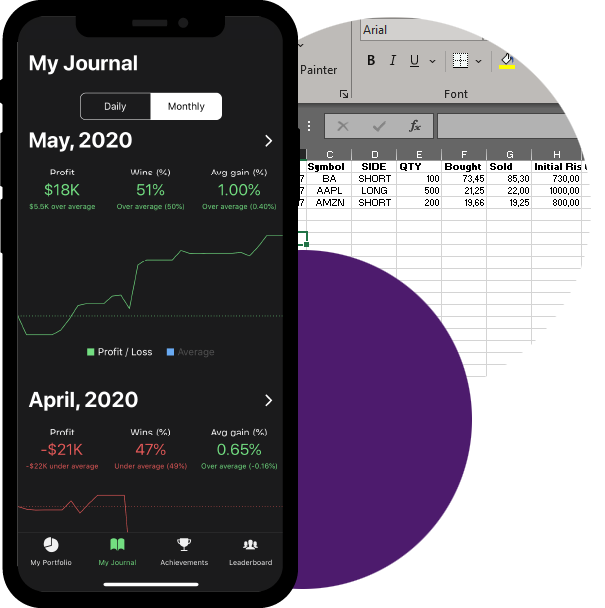
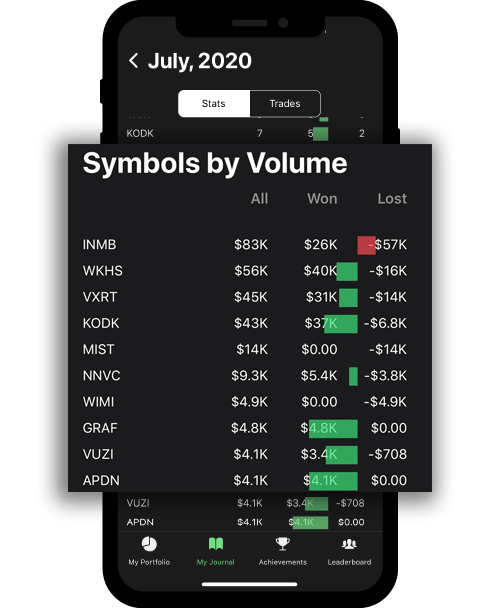
What is a Trading Journal
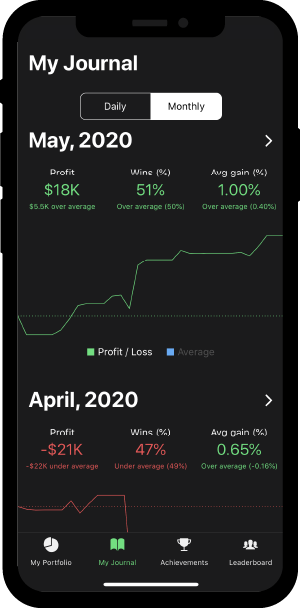
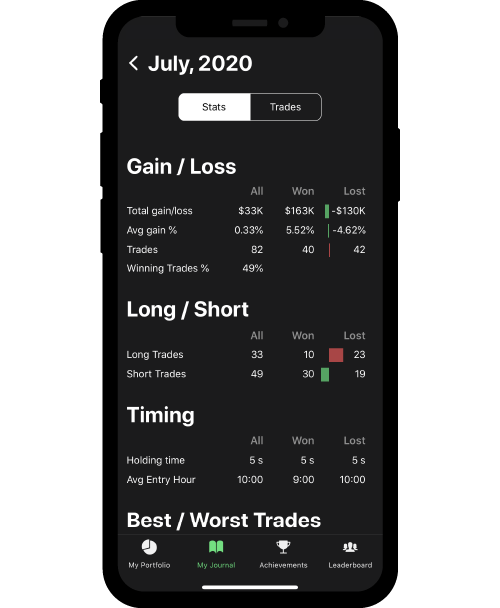
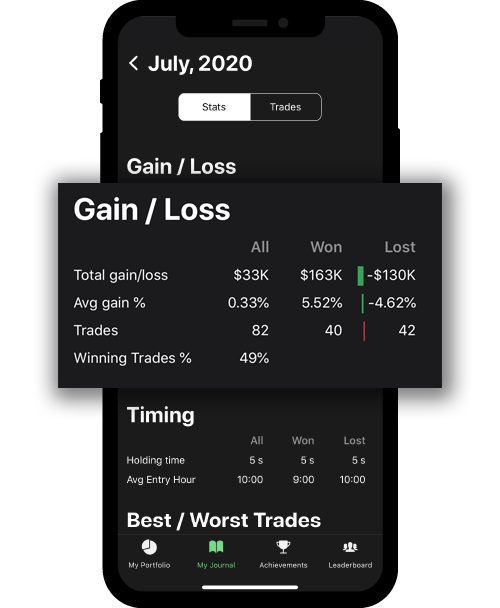
Learn more about how you can utilize kinfo as an automated trading journal
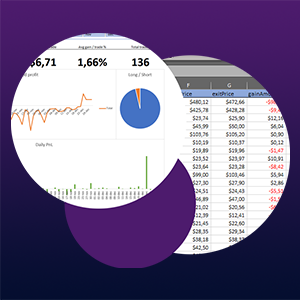
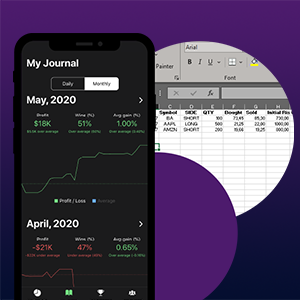
Creating a trading journal in Excel
Learn how to create a trading journal in Excel with a dynamic dashboard
Learn more about how you can utilize kinfo as an automated trading journal
Learn how to create a trading journal in Excel with a dynamic dashboard