Adapting to fit a broader market
Kinfo has gone through many changes, most things going on in the background switching out technology providers and making sure all data is delivered and presented correctly to the app.
The original idea about creating transparency and providing insights for long-term investors is still there and nothing has been removed in this change.
While looking at feedback from users I cam to realize that there are positive and negative comments which are related to different type of investing profiles.
Beginners: Think the app is too complex and have hard way of finding out where to go and are overwhelmed with the amount of information.
Experienced long-term investors: Generally have positive things to say
Day / Swing traders: Think the app lacks detailed short-term trading information
It´s great that long-term investors have good things to say about the app, the only problem is that those investors are the least active users and have the least need to acquire new information. Many are practicing a buy-and-hold strategy which is great but with less need to change anything.
Change in the interface for beginner investors
If you are completely new to investing you will make the best use of the app by looking at some of the high performing portfolios to find inspiration, learn and gain confidence for your own investment decision. A lot of beginners lack diversification and a good way to start is to look at how a well-diversified portfolio looks like.
For beginners I have just removed parts of the app related to hedge funds, insiders and analysts, it can be turned on later under settings but should make the app easier to understand at first glance.
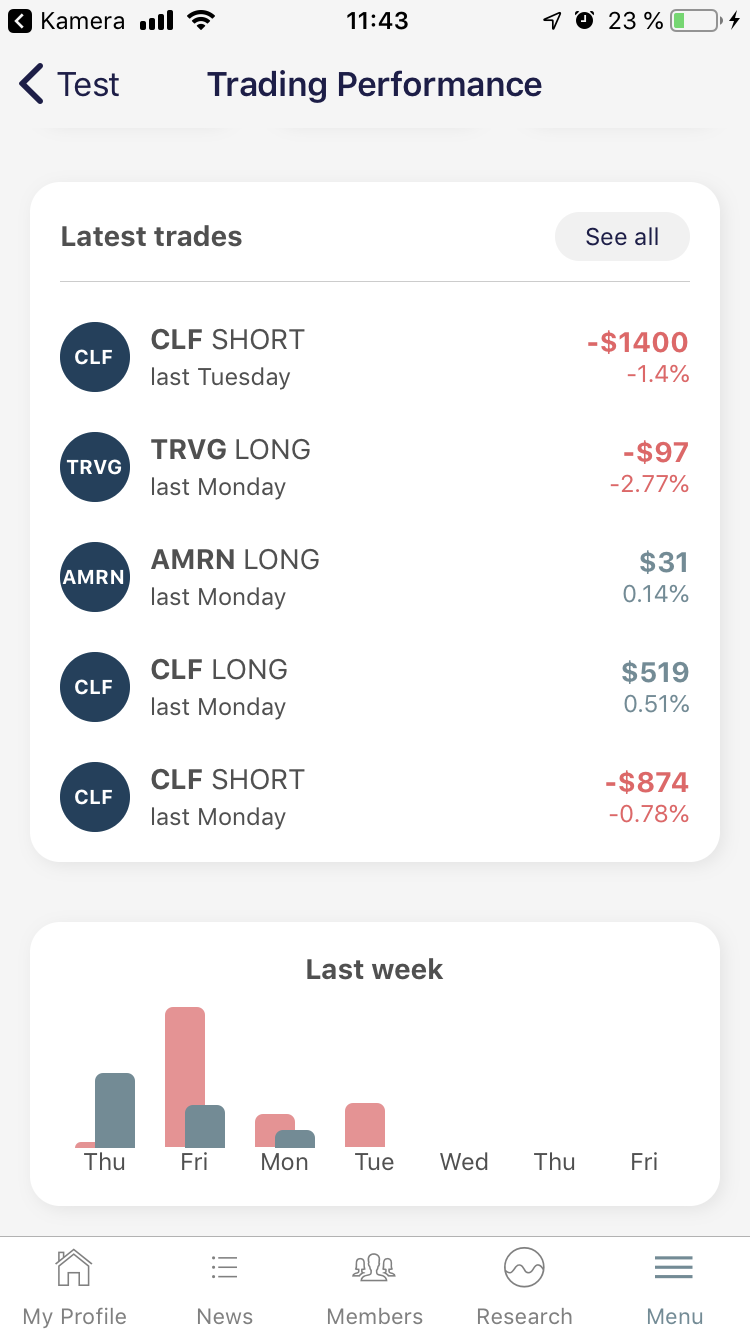
Tracking day trading and swing trading performance
The biggest change lies in a new interface and new calculated metrics for tracking day trading and swing trading performance. The new metrics are focused on your own performance based on trades constructed from transactions coming from the broker.
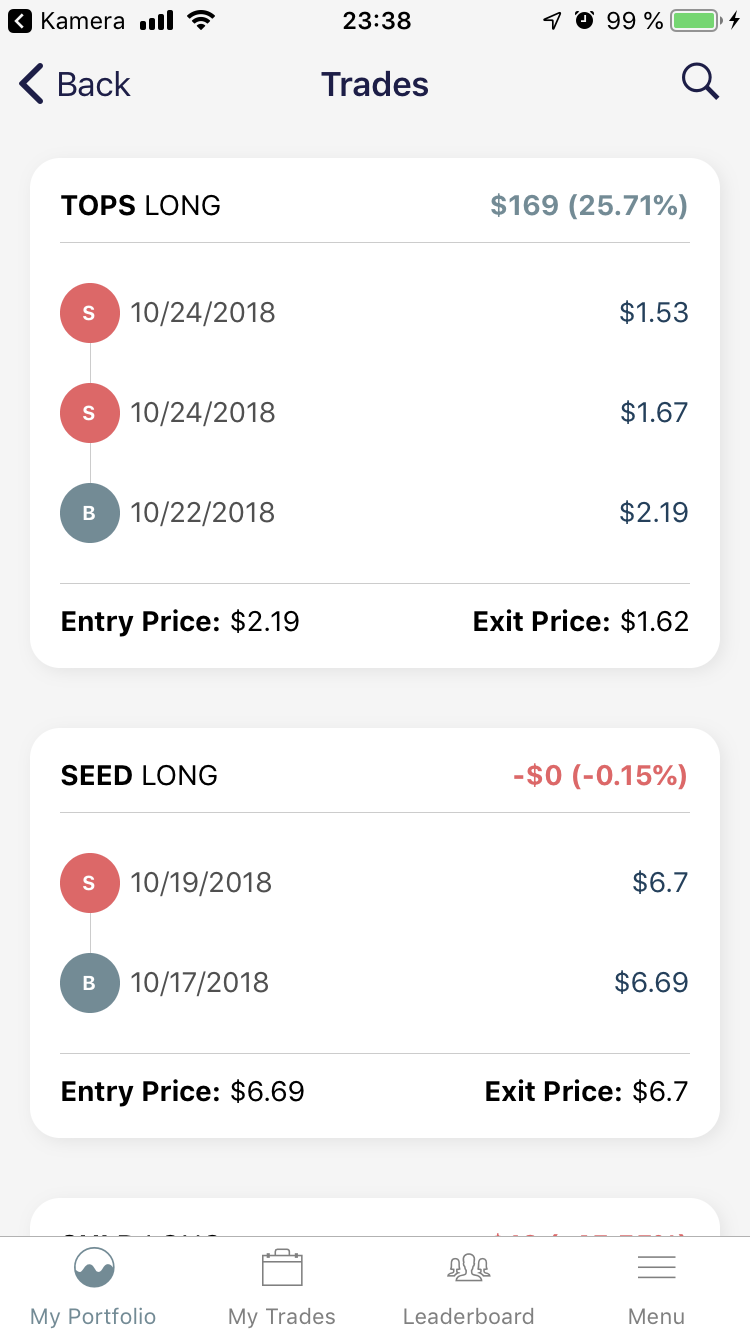
Reporting trades with entry and exit
A trade often consists of multiple transactions where a stock or an option is bought or short sold on multiple occasions and at different prices. It´s not very useful to look at the individual transactions without combining them into a full trade with an average entry price and exit price.
The new trading calculations combine transactions into trades and will calculate the gain in dollars as well as gain in % in relation to total invested capital for the trade.
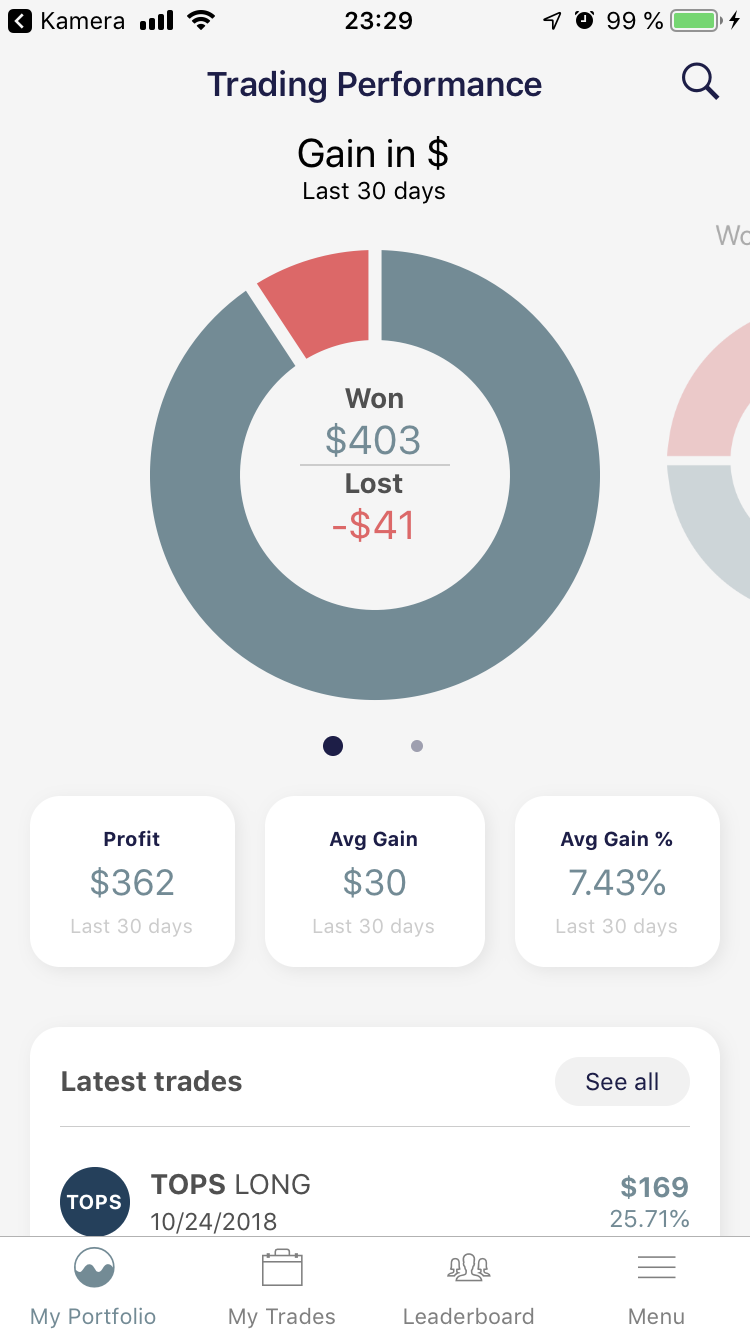
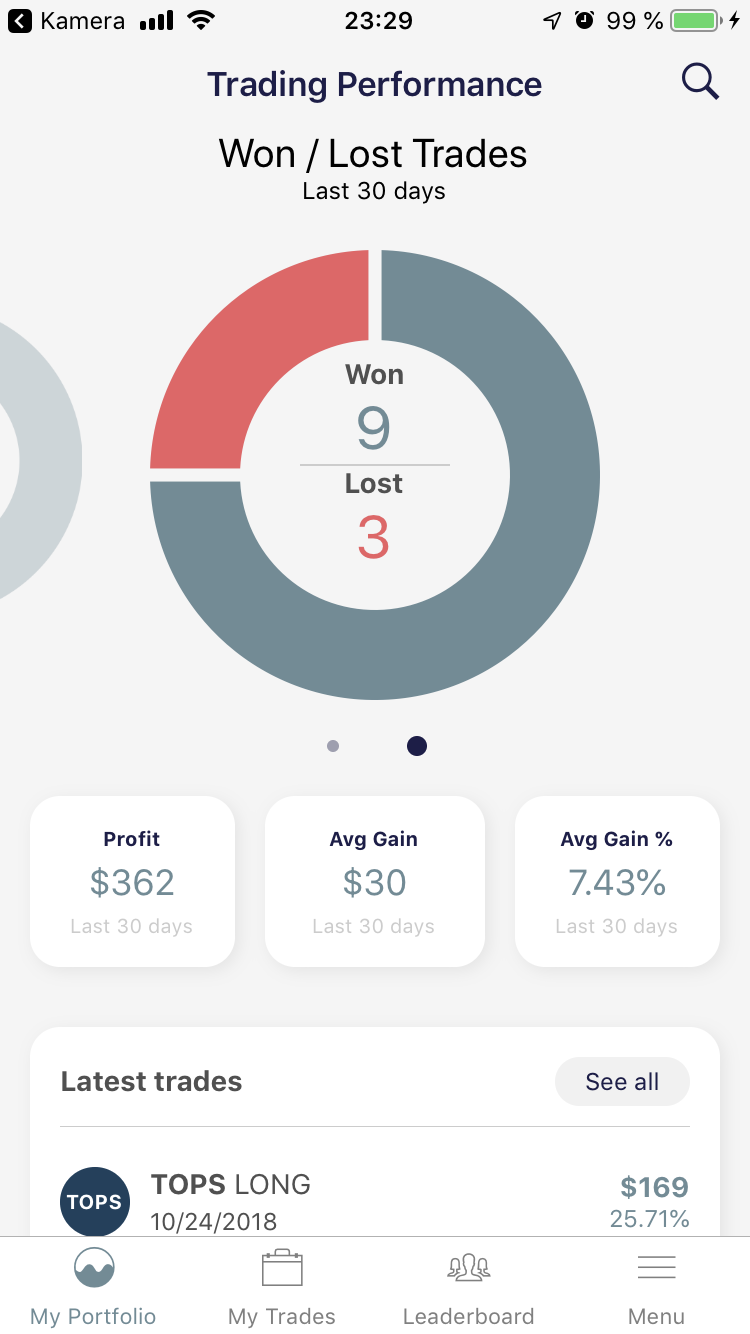
Relevant day-trading performance metrics
With the new underlying trade consolidation, a few new interesting metrics can be constructed based on those trades over time.
The first being the dollar amount gained from winning trades and correspondingly the dollar amount lost from losing trades. From this, you also have the net gain.
The other interesting metrics is how this correlates to the number of trades, for example, how many winning vs losing trades you have and the % of winning trades vs losing ones.
What´s next
This is just a starting point trying to adapt the app to fit traders as well. There is much more which could be done using the new trading data.
There is currently now rating or sharing of the information related to trades so one of the next steps is to come up with a relevant, non-sensitive metrics which can be shared to rate and compare trading performance, do you have any ideas?
I will now try to gather feedback on the new features and I´ll keep you posted on upcoming changes!